2019 Annual Statistics
The following graphs represent statistical and demographic information on adult criminal cases received by the District Attorney's Office.
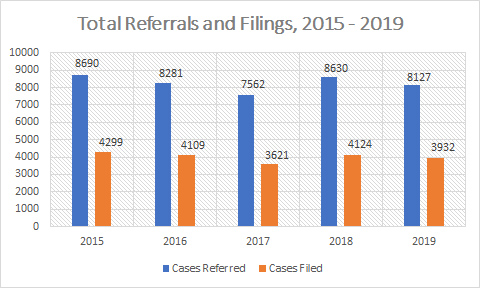
Some cases received may not be filed until the following calendar year. Similarly, cases filed includes some cases received the prior year. These data sets are not created to account for that. Filing rate, and the comparison of a particular year's referred and filed case gives a general overview.
5 year totals, cases referred and cases filed.
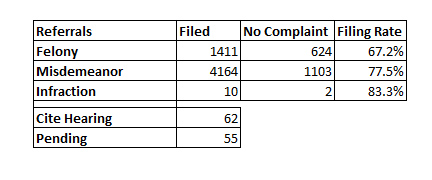
Overall Case Status, 2019
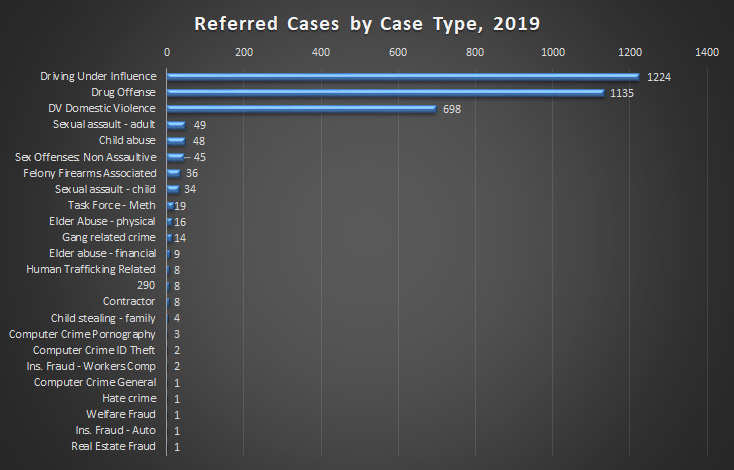
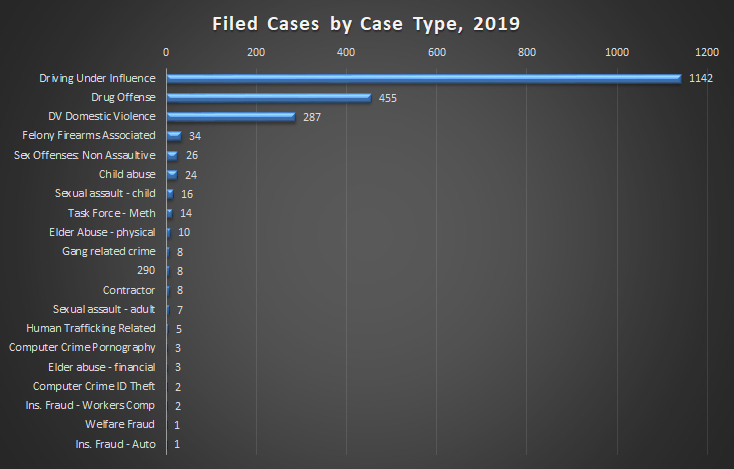
2019 Referred and Filed Cases by Crime Type
Cases can be categorized into multiple crime types. In that situation a 'Primary Crime Type' is identified, which is what is reported here. The crime type 'Other' is frequently used, and skewes the graph. For clarity, 'Other' has been removed and is depicted separately below.
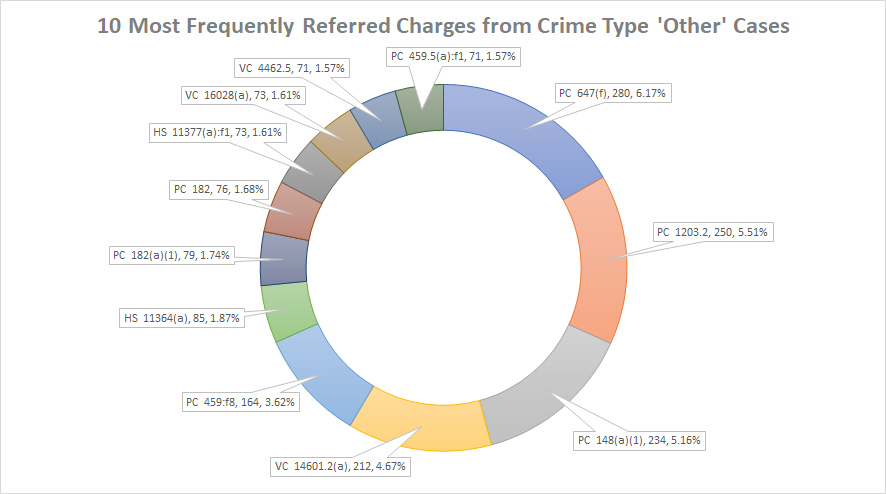
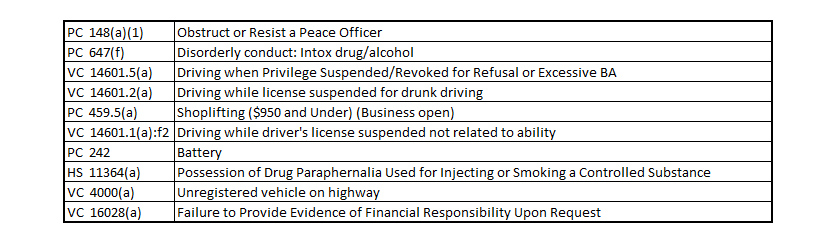
10 Most frequently appearing referred and filed charges in cases categorized as Crime Type 'Other'
4,536 charges were referred in 1,776 cases identified as crime type 'Other' in 2019. Below are the 10 most frequently referred charges. The legend displays total number of that charge, and percent of the total of all charges, (4,356).
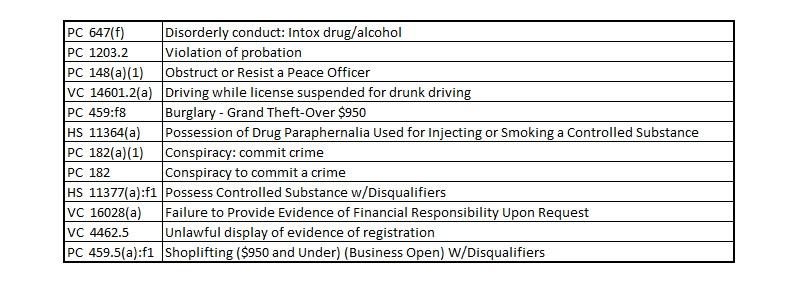
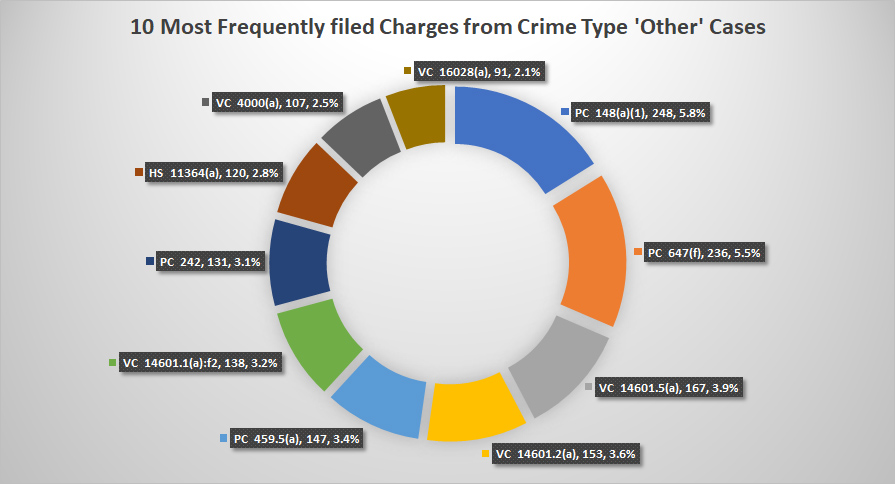
4,269 charges were filed in 1,780 cases identified as Crime Type 'Other' in 2019. Below are the 10 most frequently filed charges across those cases. The legend displays total number of that charge, and percent of the total of all charges, (4,269).
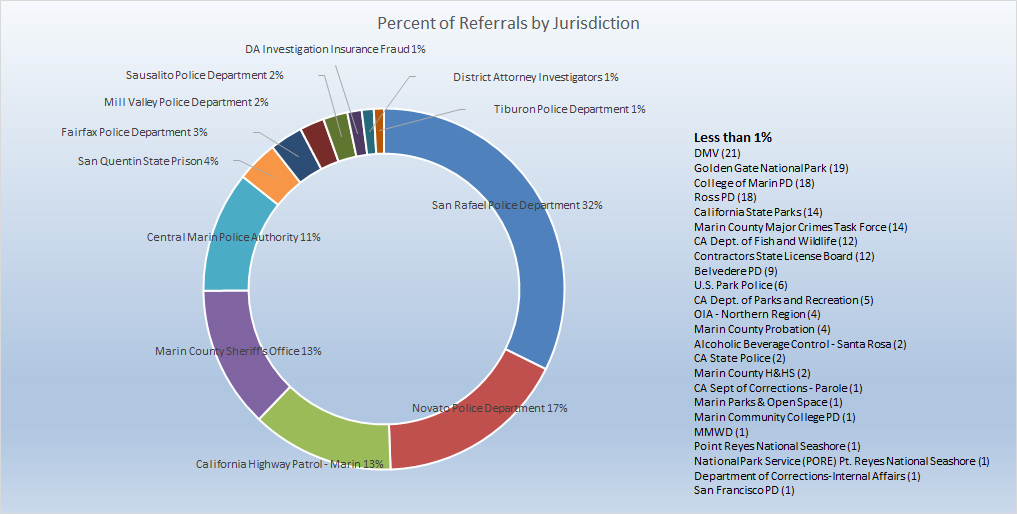
Referrals by Jurisdiction
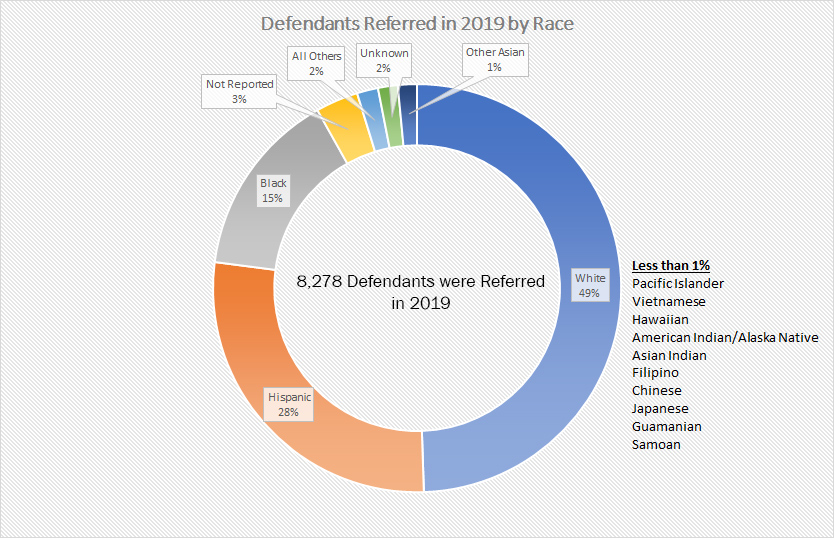
Race of Defendants, Referred and Filed Cases, 2019

Marin County
District Attorney
3501 Civic Center Drive
Suite 145
San Rafael, CA 94903
Open Monday-Friday:
8:00 AM to 4:00 PM
Phone: (415) 473-6450
Fax: (415) 473-3719

